pyMODE-TASK usage
pyMODE-TASK is a PyMOL plugin and GUI for command line based MODE-TASK tool. It include all the functionality of the MODE-TASK.
PCA of a MD trajectory
1. Preparation of trajectory
Prepare the MD trajectory as described in the tutorial section of MODE-TASK. It involves removing waters and periodicity if any.
2. PCA
- Start the plugin from PyMOL, plugin –> pyMODE-TASK.
2. Locate the pyMODE-TASK directory in the configuration tab by clicking on button “pyMODE-TASK directory”. Browse to the directory and click ok.
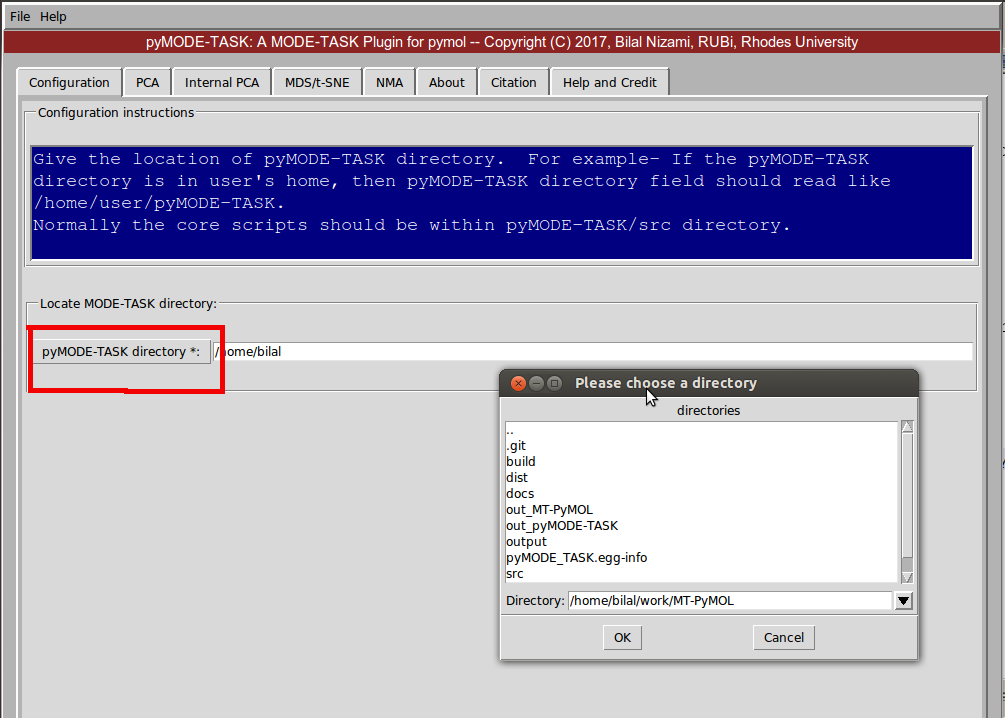
Fig 1: Set pyMODE-TASK directory
- It should look something like this
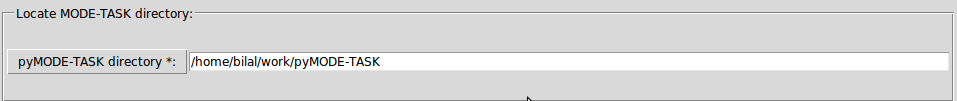
Fig 2: Set pyMODE-TASK directory
4. Next go to the PCA tab. Read the trajectory, topology and reference PDB by clicking on the respective buttons. Next select the appropriate options and click on Run PCA. The results file will be saved in a folder within the output directory.
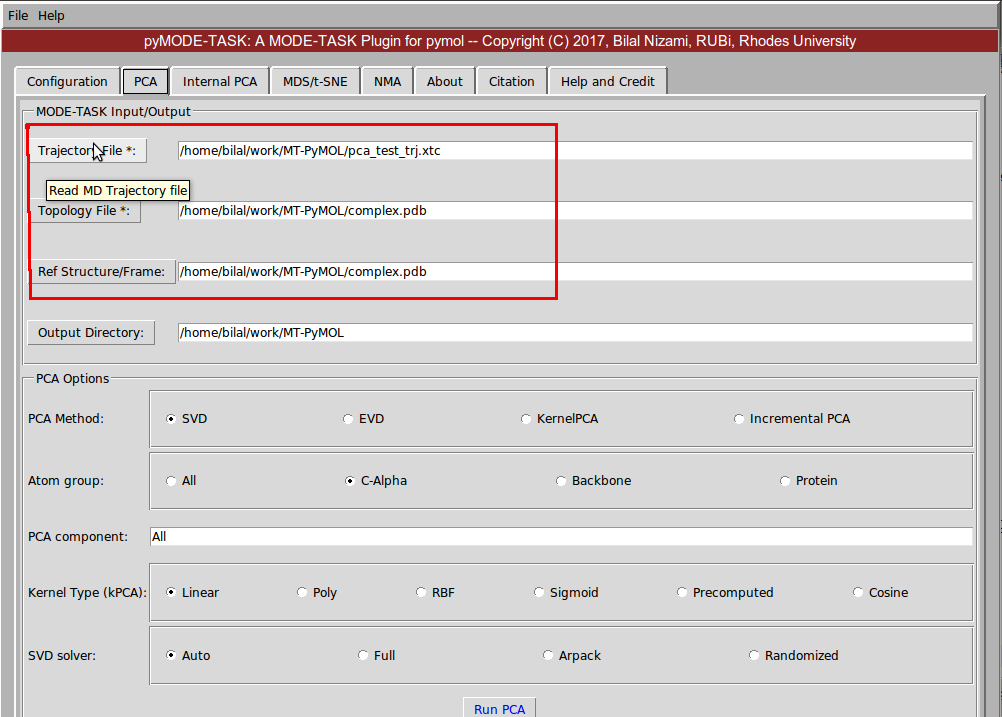
Fig 3: PCA
- If the run is successful you will see something like following
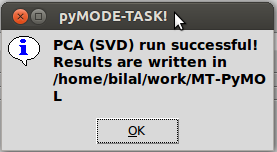
Fig 4: PCA successful
MDS and t-SNE
1. Read the trajectory, topology files by clicking on the respective buttons. Select the appropriate options under MDS options widget and click on Run MDS.
- Similarly, run the t-SNE.
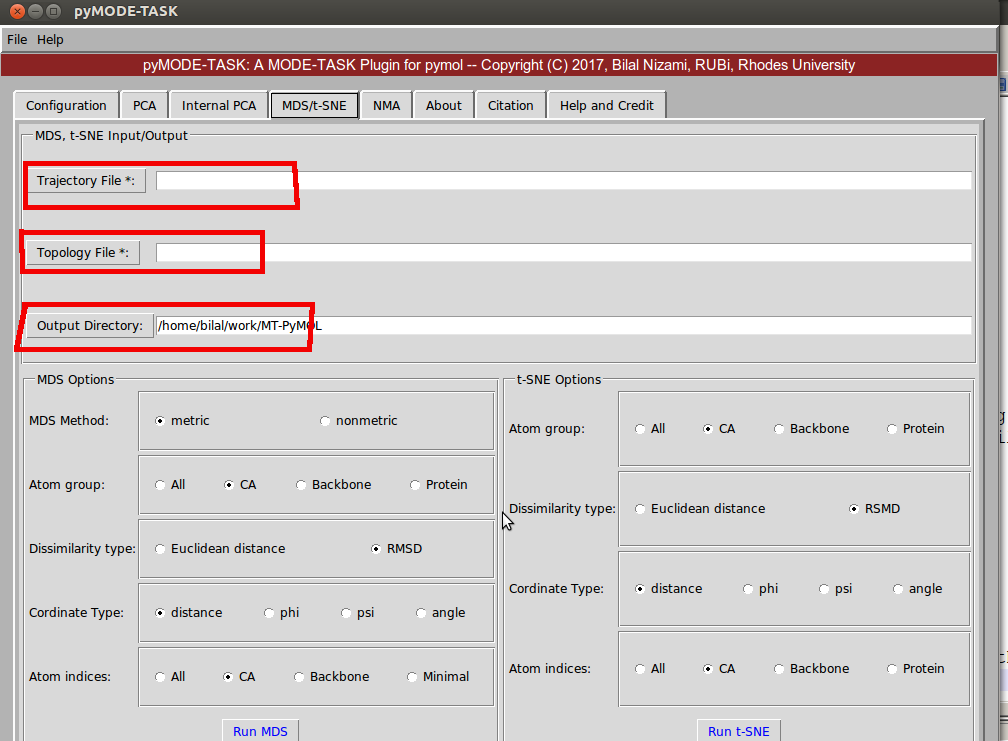
Fig 5: MDS and t-SNE
Normal mode analysis (NMA)
- Set the configuration page to locate the pyMODE-TASK directory.
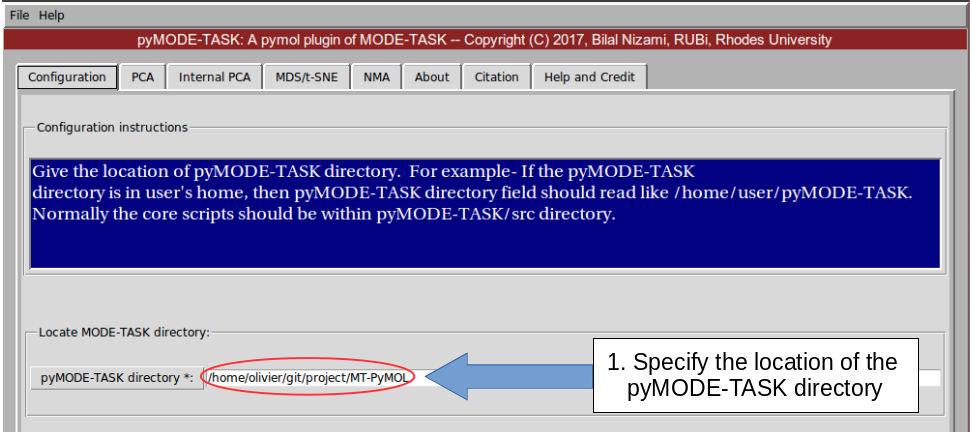
Fig 6: NMA set configuration
- Perform the coarse graining for large protein molecules.
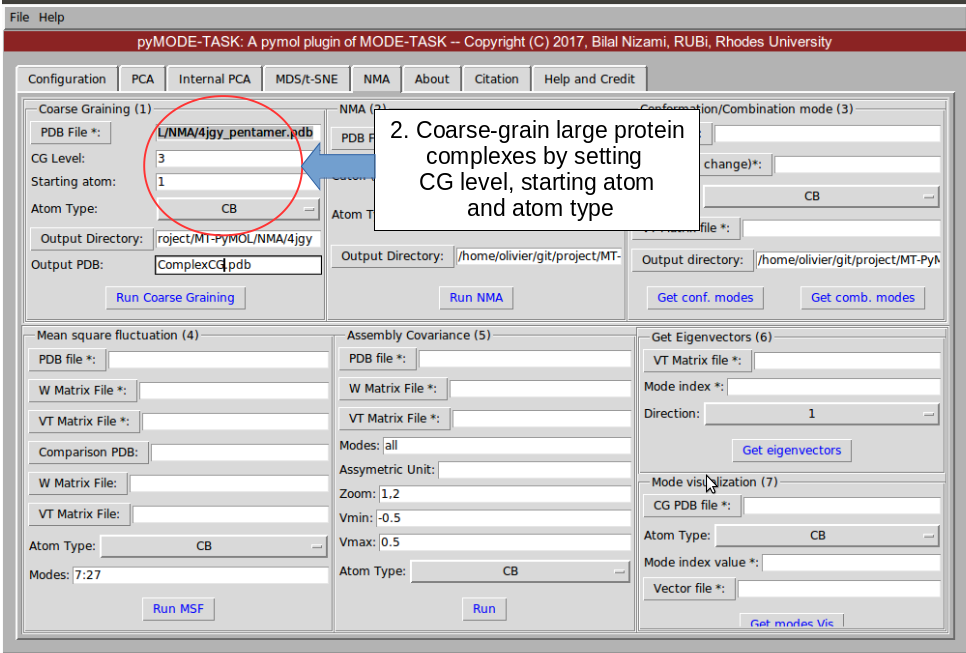
Fig 7: Coarse graining
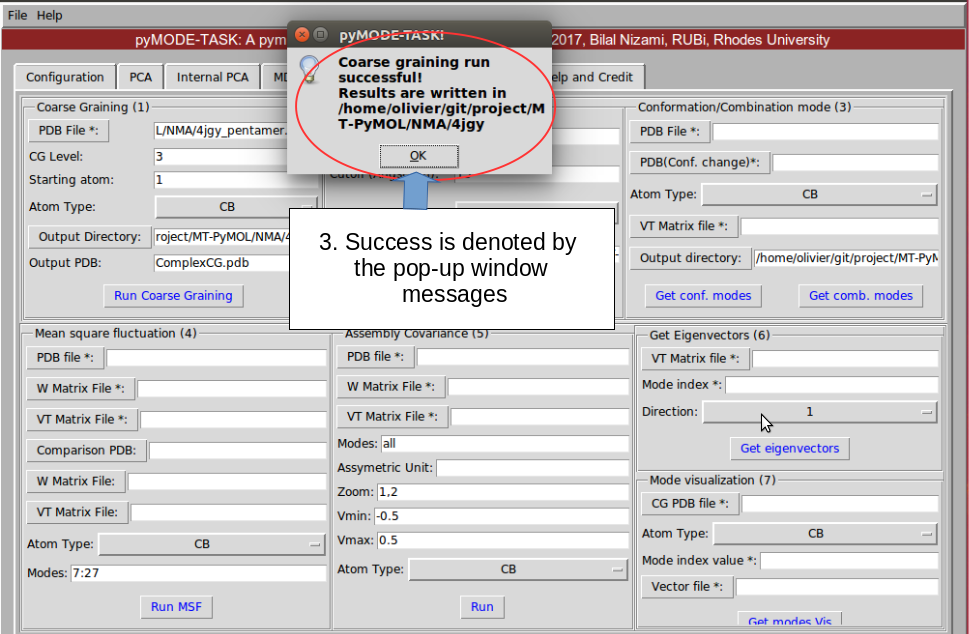
Fig 8: Coarse graining results
3. Perform the coarse graining for second conformation of the protein. This is useful in case if you want to perform “Conformation/ Combination tool analysis” and “Mean square fluctuation”.
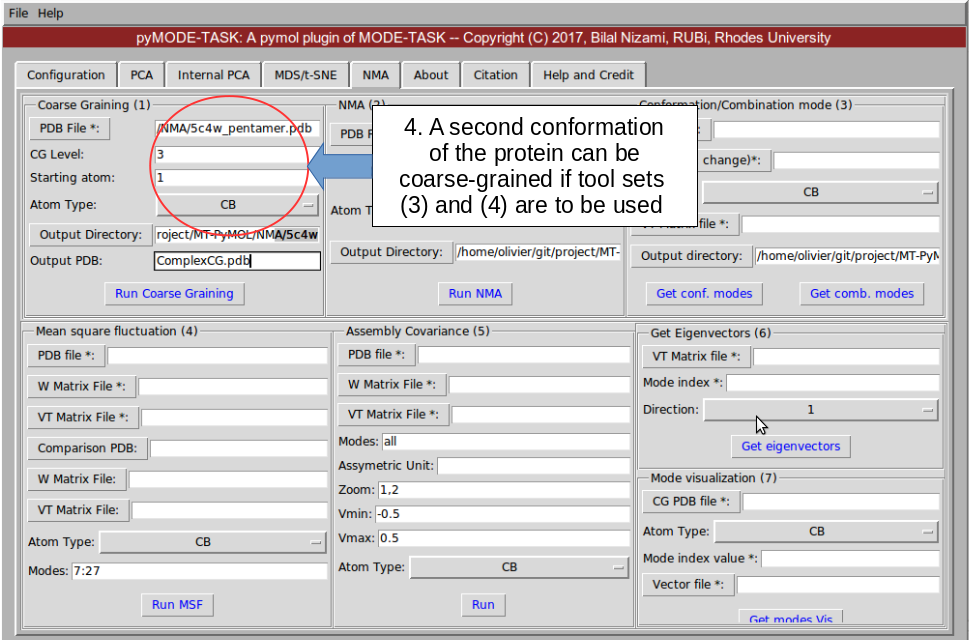
Fig 9: Coarse graining 2
- Run NMA on each coarse grained PDB using a suitable cutoff.
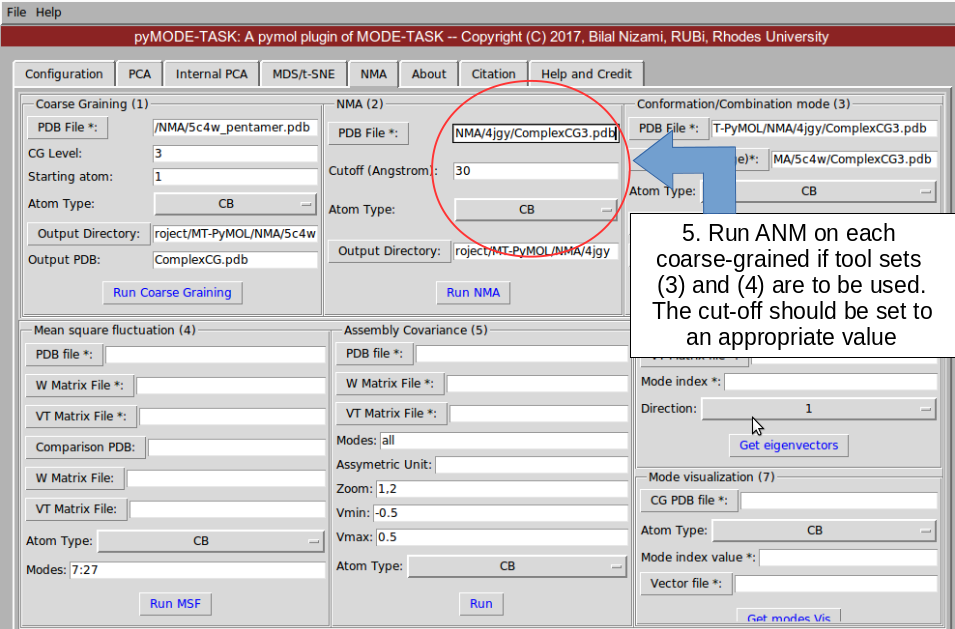
Fig 10: NMA for first PDB
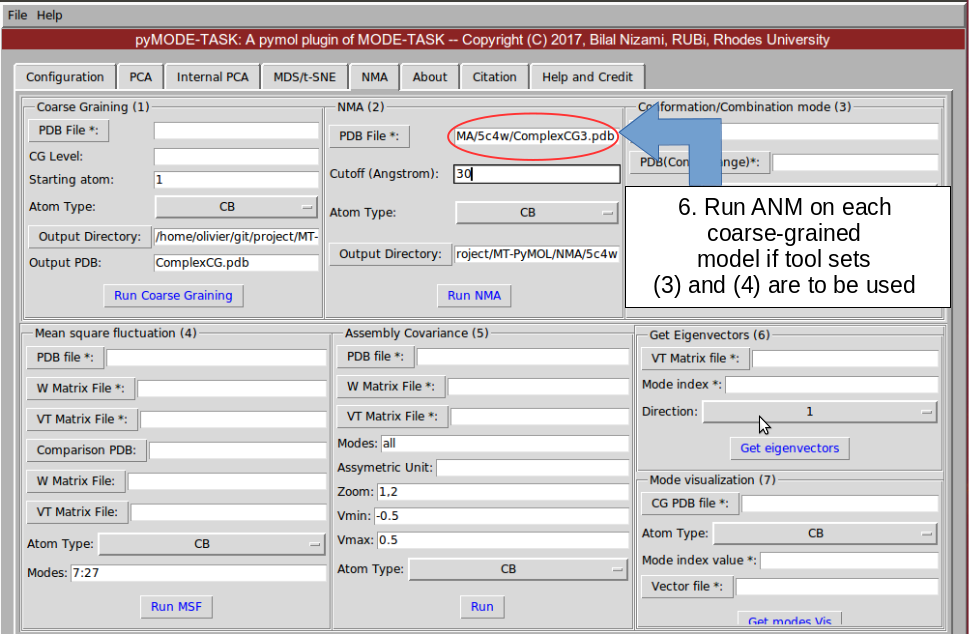
Fig 11: NMA for second PDB
- Run conformation / combination mode analysis. This require two PDB of different conformation.
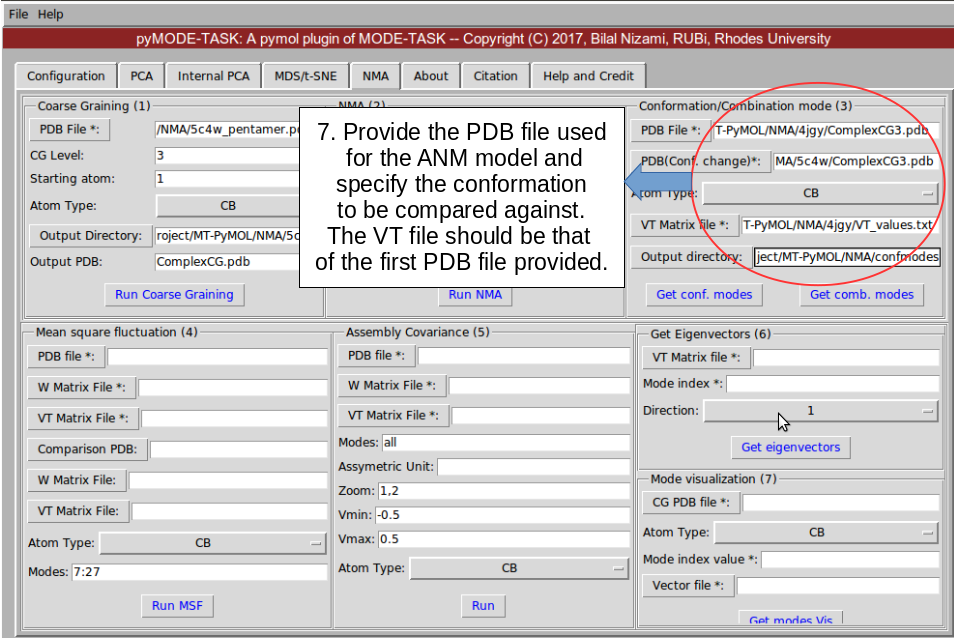
Fig 12: conformation/combination mode analysis
- Run MSF. This requires decomposed ANM matrices for comparing the mean square fluctuation between 2 proteins.
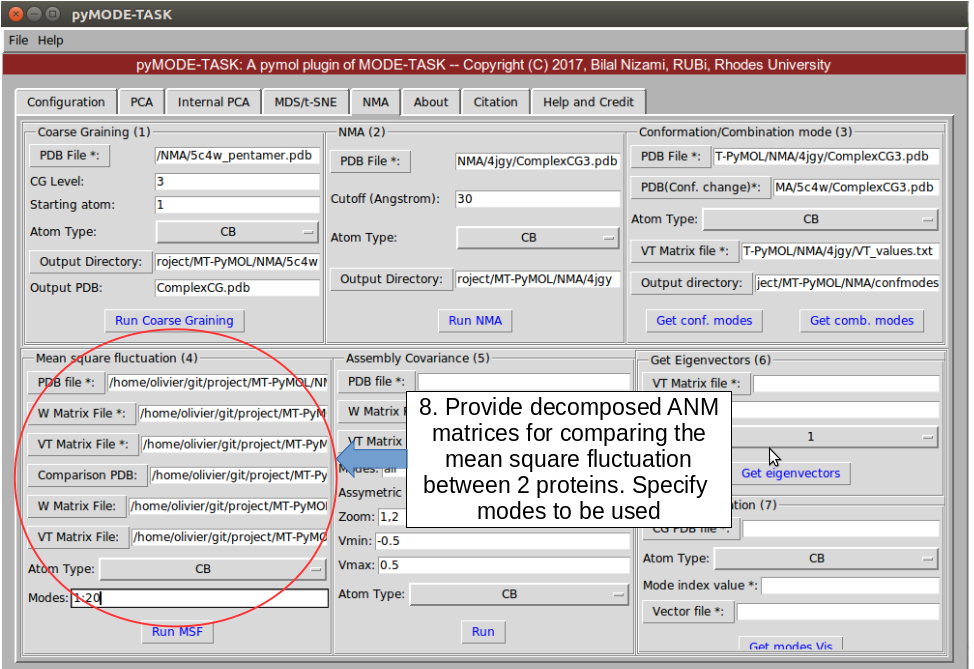
Fig 13: MSF
- Get an assembly covariance for a specified chain of an asymmetric unit
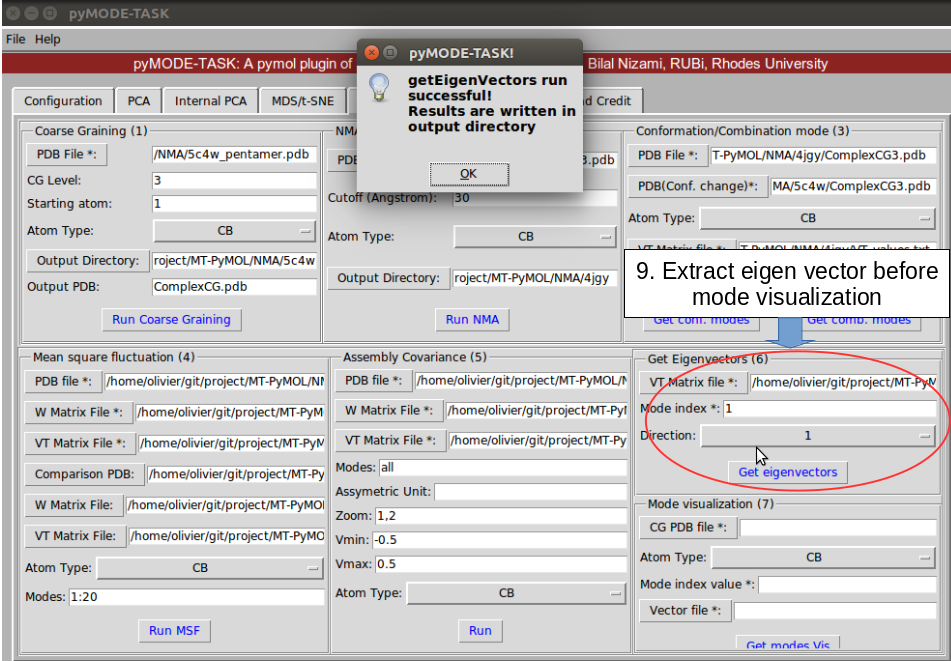
Fig 14: Get Eigenvectors
- Generate mode animation for visualization. Afterward use the following command in VMD for visualization
vmd VISUALISE/VISUAL_1.pdb -e VISUALISE/VISUAL_ARROWS_1.txt
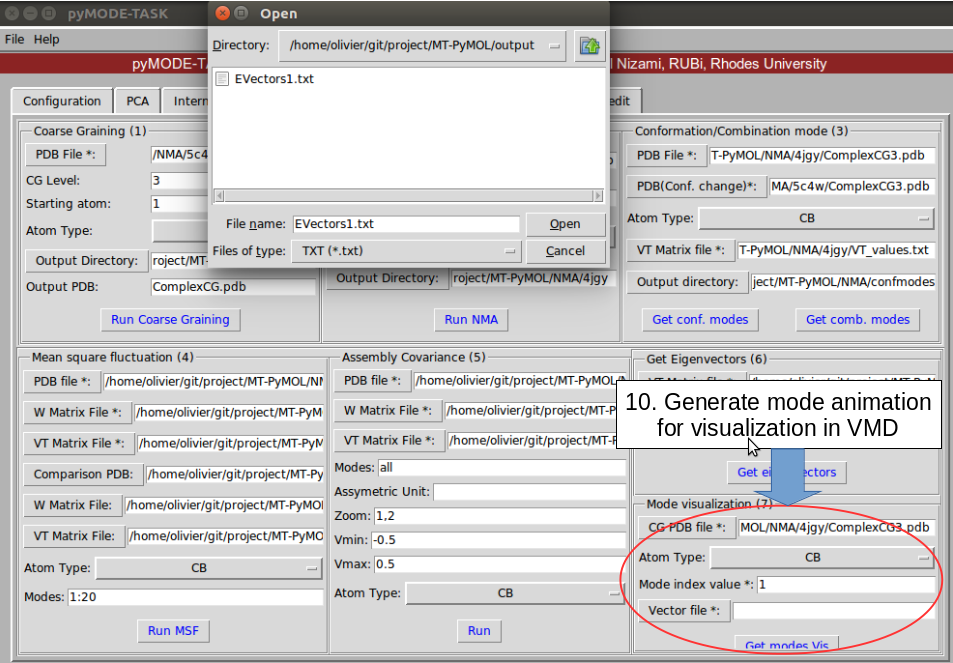
Fig 15: Mode animation